. Here it goes:
The case $k=1$
Let’s warm up with the simple case $k=1$. We’ll call $r_1(n)$ the minimum number of retreats needed to identify a single spy in a group of $n$ agents. If we choose to send $m$ of the $n$ agents on a retreat, then either a meeting took place, which means the spy is among those $m$, or no meeting took place, so the spy must be among the $n-m$ that didn’t go on the retreat. Depending on the result, we’ll either need $r_1(m)$ or $r_1(n-m)$ more retreats. We can therefore write this little (dynamic programming) recursion:
\begin{align}
r_1(1) &= 0 \\
r_1(n) &= \underset{m\in\{1,\dots,n-1\}}{\text{minimize}}\,\, 1+\text{max}\{ r_1(m), r_1(n-m) \}
\qquad\text{for }n=2,3,\dots
\end{align}The reason for the “max” is that we want a guarantee that this number of retreats will always find the spy. Therefore, we assume the spy is wherever they need to be so that it takes as long as possible to find them. From here, it’s clear that we should always split in half. Therefore,
\begin{align}
r_1(1) = 0\quad\text{and}\quad r_1(n) = 1 + r_1\bigl(\lceil \tfrac{n}{2} \rceil\bigr)
\quad\text{for }n=2,3,\dots
\end{align}Where $\lceil x \rceil$ means that we round $x$ up to the nearest integer. By inspection, we can solve this recursion and we find that:
$\displaystyle
\text{number of retreats} = r_1(n) = \lceil \log_2(n) \rceil
$
What about the cost? We can simply count the total number of retreat attendees, which we’ll call $a_1(n)$. When we split $n$ in half, we can choose to send either $\lceil \tfrac{n}{2} \rceil$ or $\lfloor \tfrac{n}{2} \rfloor$ (round up or round down) to the retreat. Both give us the same information, so we’ll choose to send fewer agents. The number of attendees therefore satisfies:
\begin{align}
a_1(1) = 0\quad\text{and}\quad a_1(n) = \lfloor \tfrac{n}{2} \rfloor + a_1\bigl(\lceil \tfrac{n}{2} \rceil\bigr)
\quad\text{for }n=2,3,\dots
\end{align}Again, by inspection, we find that the number of attendees is:
$\displaystyle
\text{number of attendees} = a_1(n) = n-1
$
Note that we could have achieved the same total cost by sending the agents one-by-one on individual retreats. By the time we’ve sent all but one agent, we must know who the spy is. However, we were asked to minimize the number of retreats, so it would be wasteful to have this many retreats.
The case $k\gt 1$
The case $k=1$ was all about finding one spy. There were $n$ possibilities (each of the $n$ agents could be the spy) and each time we had a retreat, we received one bit of information (yes/no). The best we could do was use that bit to cut our possibilities by a factor of two, and this was achievable by sending half of the agents on the retreat each time.
If $k \gt 1$, we are tasked with finding $k$ spies, and there are now $\binom{n}{k}$ possibilities (choosing $k$ spies out of $n$ agents). Again, the logic is the same: the best we can hope for with one bit of information is to reduce the possibilities by a factor of two. If we call $r_k(n)$ the minimum number of retreats required to identify the spies with certainty, then this argument yields the bound:
$\displaystyle
\text{number of retreats} = r_k(n) \ge \left\lceil \log_2\binom{n}{k} \right\rceil
$
If $n=1024$ and $k=17$, this yields the bound $r_{17}(1024) \ge 122$. The question then becomes: how close can we actually come to reaching this bound? One possible approach is to be greedy: we keep track of all possible remaining subsets, then we consider all possible retreat arrangements and use the one that reduces the number of remaining subsets by as much as possible (which can never be more than than a factor of two). We continue in this fashion until we have reduced the number of possible subsets to one, and that must be our set of spies.
While this greedy approach would likely be optimal, it’s computationally intractable. There are $\binom{1024}{17} \approx 3.68\times 10^{34}$ possible subsets of spies and there are $2^{1024} \approx 1.8\times 10^{308}$ possible retreats we could arrange at every step. So there is no hope of computing the optimal greedy strategy and seeing how well it performs compared to our lower bound.
We can think of this as a game, where I’m trying to guess the spies and the adversary is trying to arrange the spies such that it’s as difficult as possible for me to guess. So this becomes a philosophical question: if I pick a split such that there is a slight advantage for my adversary to say “yes, there was a meeting”, then as long as they keep saying “yes”, the solution is recursive and easily computable. But if my adversary knows that the problem gets very hard whenever they say “no, there was no meeting”, they they might just do something “suboptimal” with the goal of running me out of memory.
Suboptimal heuristic
The greedy heuristic seems out of reach, so here is another heuristic, which was truly a team effort — discussions with my colleague Alberto Del Pia, comments on this post by Jim Crimmins, Adam, and Jason Weisman, as well as a little bit of effort on my end. The idea is to split the $n$ agents into $m$ groups of roughly equal size, where $k+1 \le m \le n$. Let’s number the groups $1,\dots,m$. Here is the plan:
- Take
- Group 1 stays home, all other groups go on a retreat.
- If there was a meeting, then Group 1 has no spies in it.
- If there was no meeting, then Group 1 has at least one spy in it.
- Return to step 1, but this time, Group 2 stays home and all other groups go on a retreat.
- Keep going in this fashion until we have identified all groups with at least one spy in them. There can be at most $k$ such groups. Merge these groups (this becomes our new $n$), discard all other groups, and repeat the entire process with the new smaller group: picking $m$, dividing into groups, etc.
Note that we do not need to try all $m$ possible retreats in each round! As soon as there are $k$ retreats with “no meeting”, then we can stop and immediately proceed to the next round, since we now know which $k$ groups contain spies. In the worst case, this won’t happen. We will always be forced to have as many retreats as possible. By the time we have done $m-1$ retreats, two things can happen:
- We have identified $k$ spies, in which case we can carry over our $k$ spy-containing groups to the next round immediately.
- We have identified $k-1$ spies, in which case we can just carry over the last group to the next round without testing it.
In either case, we only require $m-1$ retreats and we always send $k$ groups to the next round. So there is never any need to have all $m$ retreats in a given round. To see what happens at each round, note that if we divide $n$ into $m$ groups, then to figure out the group sizes, let $q$ and $r$ be the quotient and remainder, respectively, when we divide $n$ by $m$. So $n = qm + r$, with $0\le r\le m-1$. Then $n$ will be divided into $m$ groups as follows:
\[
n = \underbrace{q+\cdots+q}_{m-r} + \underbrace{(q+1) + \cdots + (q+1)}_{r}
\]But which groups carry over to the next round? Since we get to choose the order in which we schedule the retreats, and not all groups are of equal size, we can ensure that the last group (corresponding to the last retreat that never happens) is as small as possible. But it’s also possible that our $(m-1)^\text{th}$ group gets sent to the next round instead. So our best bet is to keep the two smallest groups for last. Ultimately, the worst case will see the $k-1$ largest groups and the $2^\text{nd}$ smallest group sent to the next round. Let’s call $g(n,m)$ this number. It’s somewhat annoying to compute $g(m,n)$, since it depends on the relative size of $k$ and $r$, but it’s approximately equal to $kn/m$. Here is what the recursion looks like:
\[
r_k(k) = 0\qquad\text{and}\qquad
r_k(n) = \underset{m\in\{k+1,\dots,n\}}{\text{minimize}}\,\, \left( m-1 + r_k( g(n,m) ) \right)
\]The recursion can be solved in a straightforward manner using recursion. Here is some Julia code along with the full computation of $g(n,m)$ that does the job:
nmax = 1024
k = 17

memo = -1 + zeros(Int,nmax)

# if n agents are divided into m groups, pick k-1 largest and 2nd smallest
function g(n,m,k)
    # n = q*(m-r) + (q+1)*r
    q,r = floor(Int,n/m), rem(n,m)
    if m == k+1  # we must pick the k largest in this case
        (r >= k ? k*(q+1) : r*(q+1) + (k-r)*q)
    else  # pick the k-1 largest and the 2nd smallest in this case
        (r >= k-1 ? (k-1)*(q+1) : r*(q+1) + (k-1-r)*q) + (m-r >= 2 ? q : q+1)
    end
end

function rk(n)
    if memo[n] != -1
        memo[n]
    else
        memo[n] = ( n == k ? 0 : minimum([m-1+rk(g(n,m)) for m=k+1:n]) )
    end
end

rk(1024)
In the first round, we have $n=1024$ suspects. The optimal thing to do is to choose $m=43$ groups, leaving us with $407$ suspects. Then we choose $51$ groups to get down to $136$ suspects. Then choose $46$ groups again to get down to $50$ suspects. Finally, we choose $50$ groups and we’re down to $17$ suspects, which must be our spies. So the total is $(43-1)+(51-1)+(46-1)+(50-1)=186$ total retreats. Interestingly, if we use the approximation $g(n,m) \approx \lceil \tfrac{kn}{m} \rceil$, we also get the result of $186$. Together with our previously derived lower bound, we obtain:
$\displaystyle
\text{number of retreats}:\quad 122 \leq r_{17}(1024) \leq 186
$
The lower bound means that it’s impossible for any strategy to do better than this, but there may not be any strategies that are this good. The upper bound says it’s definitely possible to do this well using a particular strategy, but other strategies might do better. In this case, the ratio between our upper and lower bounds is about 1.52. This sort of ratio is used in approximation theory to quantify the quality of a proposed solution when the problem is hard to solve exactly.
How about the cost? We will approximate. For each round, in the worst case, we have $m$ retreats, where $k$ of them have meetings and $m-k$ do not. Whenever there is a meeting, the group that stayed home can be excluded forever after (since we know it contains no spies), so we don’t need to send that group on subsequent retreats. The most expensive thing that can happen is that our $k$ retreats with meetings come last. So the total number of attendees will be approximately:
\begin{align}
a(n,m) &\approx (m-1-k)\left(n-\tfrac{n}{m}\right) + \sum_{j=1}^k \left(n-j\tfrac{n}{m}\right)\\
&\approx \frac{n \left(k-k^2+2 (m-1)^2\right)}{2 m}
\end{align}So if we end up choosing $m$ groups when there are $n$ attendees, we should add $a(n,m)$ to our running count of attendees. Incorporating this using the solution found above, we obtain the result that the strategy will require sending about $65484$ attendees to retreats. At a cost of \$1,000 per attendee, this means it will cost at most \$65.48 million to find all the spies.
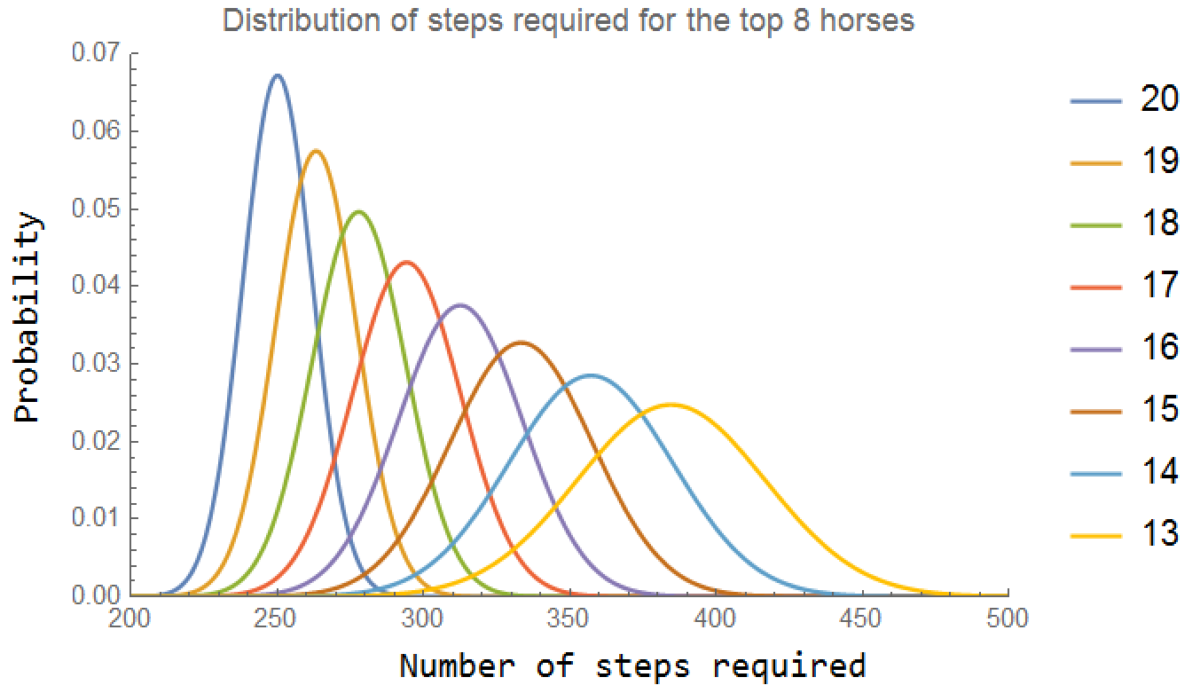
For the curious, here is a plot showing the maximum number of retreats required to sniff out 17 spies, as a function of the total number of agents:

As we can see, the upper and lower bounds start close together but end up spreading apart as $n$ increases.
Minimizing cost instead?
The problem statement asked us to minimize the number of retreats, which led us to 186 retreats at a cost of \$65.48 million. If instead we attempted to minimize dollars using a similar strategy of dividing into groups and keeping one group home, we can formulate a similar recursion to the one above, except this time we perform the minimization over cost rather than retreats. The result in this case is 220 retreats at a cost of \$54.46 million. This makes sense. We can lower the cost if we want, but only at the expense of adding more retreats.
Even better!
It turns out the upper bound can be reduced to $131$ by instead singling out one spy at a time! This turns out to have a much better worst-case performance than splitting the remaining agents into equally-sized groups as I described in my solution. As one might expect, the worst-case cost in dollars goes up dramatically. The solution, due to Tim Black, can be found here. It still remains to be seen whether there exists a simple strategy that can further close the gap between the lower bound of 122 and the new upper bound of 131.